This tutorial explains how to import historical stock prices from Yahoo Finance into Google Sheets.
How to Use the File : First make a copy by selecting File > Make a copy. While running the script, Google will ask you to authorize Appscript once.
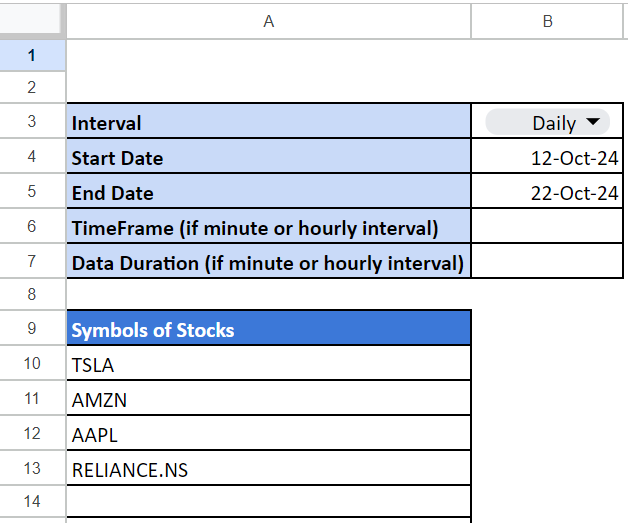
Then enter the tickers for which you want to download historical information, starting from cell A10.
Specify period, start and end date and then hit "Pull Data" button.
In this tool, you have flexibility to play around with the following arguments -
IntervalYou can select the frequency of historical data for stocks - Minute, Hourly, Daily, Weekly, Monthly.Starting DateDate on which you want historical data starts fromEnd DateDate on which you want historical data ends with. Please note that the end date is not included in the range.
There are two ways to get the real-time price of a stock.
- Set start and end date blank. Make sure period is set as 'Daily'.
- Set the latest date as the Starting Date and (latest date + 1) as the End Date. For example If you want data for 22nd February, specify 23rd February in the "End Date" argument and 22nd February in the "Starting Date" argument.
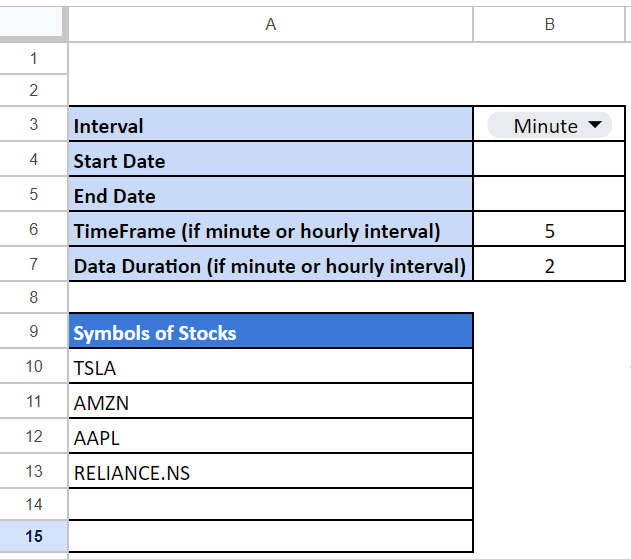
In cell B6, specifying 5 means five-minute time frame when interval is "Minute". In cell B7, specifying 2 means that two days of data are required for a 'minute' or 'hourly' interval.
Please note that the start date and end date arguments are not considered when the interval is set to either "Minute" or "Hourly".
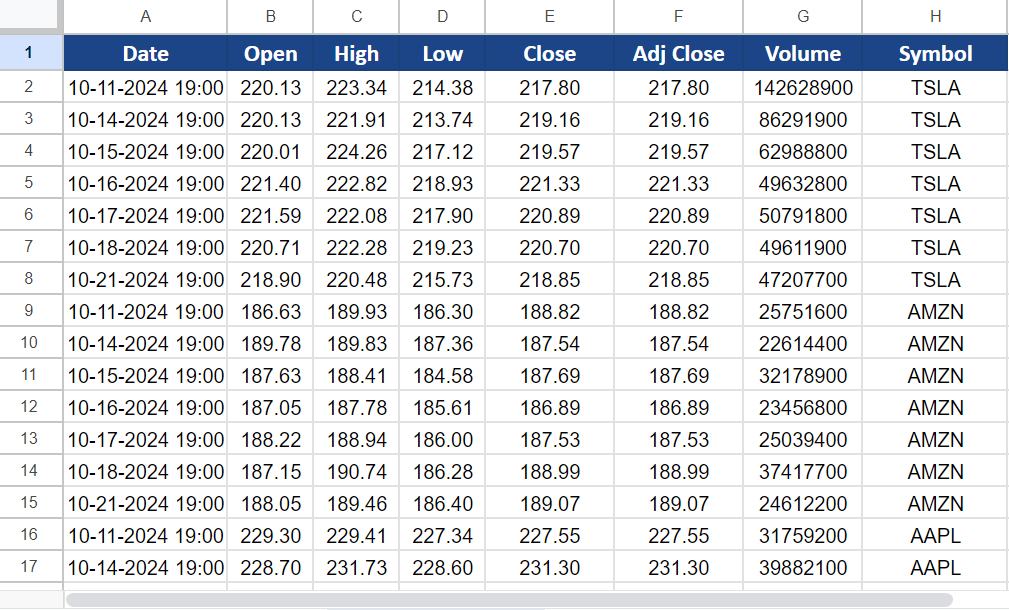
In the output, we will have stock data with a five-minute time frame presented in tabular format.
Please note that the macro returns time in local timezone.
Check out this link to download Historical Dividends Data
For US Stocks Yahoo Finance does not require any suffix added in symbols or tickers. You can use it directly. However suffix needs to be entered for non US stocks. See some of the examples below.
| Canadian Stocks | Indian Stocks |
|---|---|
| DOL.TO | RELIANCE.NS |
| ENGH.TO | TCS.NS |
| AC.TO | HCLTECH.NS |
Table below shows a complete list of stock exchanges across world and corresponding suffix used for fetching stock quotes from Yahoo Finance.
| Country | Market | Suffix |
|---|---|---|
| Argentina | Buenos Aires Stock Exchange (BYMA) | .BA |
| Austria | Vienna Stock Exchange | .VI |
| Australia | Australian Stock Exchange (ASX) | .AX |
| Belgium | Euronext Brussels | .BR |
| Brazil | Sao Paolo Stock Exchange (BOVESPA) | .SA |
| Canada | Canadian Securities Exchange | .CN |
| Canada | NEO Exchange | .NE |
| Canada | Toronto Stock Exchange (TSX) | .TO |
| Canada | TSX Venture Exchange (TSXV) | .V |
| Chile | Santiago Stock Exchange | .SN |
| China | Shanghai Stock Exchange | .SS |
| China | Shenzhen Stock Exchange | .SZ |
| Czech Republic | Prague Stock Exchange Index | .PR |
| Denmark | Nasdaq OMX Copenhagen | .CO |
| Egypt | Egyptian Exchange Index (EGID) | .CA |
| Estonia | Nasdaq OMX Tallinn | .TL |
| Europe | Euronext | .NX |
| Finland | Nasdaq OMX Helsinki | .HE |
| France | Euronext Paris | .PA |
| Germany | Berlin Stock Exchange | .BE |
| Germany | Bremen Stock Exchange | .BM |
| Germany | Dusseldorf Stock Exchange | .DU |
| Germany | Frankfurt Stock Exchange | .F |
| Germany | Hamburg Stock Exchange | .HM |
| Germany | Hanover Stock Exchange | .HA |
| Germany | Munich Stock Exchange | .MU |
| Germany | Stuttgart Stock Exchange | .SG |
| Germany | Deutsche Boerse XETRA | .DE |
| Greece | Athens Stock Exchange (ATHEX) | .AT |
| Hong Kong | Hong Kong Stock Exchange (HKEX)*** | .HK |
| Hungary | Budapest Stock Exchange | .BD |
| Iceland | Nasdaq OMX Iceland | .IC |
| India | Bombay Stock Exchange | .BO |
| India | National Stock Exchange of India | .NS |
| Indonesia | Indonesia Stock Exchange (IDX) | .JK |
| Ireland | Euronext Dublin | .IR |
| Israel | Tel Aviv Stock Exchange | .TA |
| Italy | EuroTLX | .TI |
| Italy | Italian Stock Exchange | .MI |
| Japan | Tokyo Stock Exchange | .T |
| Latvia | Nasdaq OMX Riga | .RG |
| Lithuania | Nasdaq OMX Vilnius | .VS |
| Malaysia | Malaysian Stock Exchange | .KL |
| Mexico | Mexico Stock Exchange (BMV) | .MX |
| Netherlands | Euronext Amsterdam | .AS |
| New Zealand | New Zealand Stock Exchange (NZX) | .NZ |
| Norway | Oslo Stock Exchange | .OL |
| Portugal | Euronext Lisbon | .LS |
| Qatar | Qatar Stock Exchange | .QA |
| Russia | Moscow Exchange (MOEX) | .ME |
| Singapore | Singapore Stock Exchange (SGX) | .SI |
| South Africa | Johannesburg Stock Exchange | .JO |
| South Korea | Korea Stock Exchange | .KS |
| South Korea | KOSDAQ | .KQ |
| Spain | Madrid SE C.A.T.S. | .MC |
| Saudi Arabia | Saudi Stock Exchange (Tadawul) | .SAU |
| Sweden | Nasdaq OMX Stockholm | .ST |
| Switzerland | Swiss Exchange (SIX) | .SW |
| Taiwan | Taiwan OTC Exchange | .TWO |
| Taiwan | Taiwan Stock Exchange (TWSE) | .TW |
| Thailand | Stock Exchange of Thailand (SET) | .BK |
| Turkey | Borsa İstanbul | .IS |
| United Kingdom | London Stock Exchange | .L |
| Venezuela | Caracas Stock Exchange | .CR |
The following script assumes that the period (Daily/Weekly/Monthly) is specified in cell B3, with the start and end dates for which you want stock data in cells B4 and B5. In cells B6 and B7, it is assumed that the time frame and data duration are provided for either a 'minute' or 'hourly' interval data requirement. The tickers should start from cell A10.
function getData() {
  var ss = SpreadsheetApp.getActiveSpreadsheet();
  var inputControls = ss.getSheetByName("Sheet1");
  var outputData = ss.getSheetByName("HistoricalData");
  var symbol;
  var startDate;
  var endDate;
  var period;
  var timeframe;
  var rng;
  var lastRow;

  // Disable screen updating and alerts
  SpreadsheetApp.flush(); // Refresh the spreadsheet

  // Sheet Names
  lastRow = inputControls.getLastRow();

  // Arguments
  var b4Value = inputControls.getRange("B4").getValue();
  var c4Value = inputControls.getRange("B5").getValue();
  var startDate = isNaN(new Date(b4Value).getTime()) ? NaN : Math.floor(new Date(b4Value).getTime() / 1000);
  var endDate = isNaN(new Date(c4Value).getTime()) ? NaN : Math.floor(new Date(c4Value).getTime() / 1000);

  period = inputControls.getRange("B3").getValue();
  timeframe = inputControls.getRange("B6").getValue();
  rng = inputControls.getRange("B7").getValue();

  var dateDifference = (new Date(inputControls.getRange("B5").getValue()).getTime() - new Date(inputControls.getRange("B4").getValue()).getTime()) / (1000 * 3600 * 24);

  if (period === "Minute" || period === "Hourly") {
    if (!timeframe || !rng) {
      SpreadsheetApp.getUi().alert("Cells B6 and B7 cannot be empty when Interval is 'Minute' or 'Hourly'");
      return;
    }
  } else {
    if (inputControls.getRange("B4").getValue() && inputControls.getRange("B5").getValue() && dateDifference < 1) {
      SpreadsheetApp.getUi().alert("Date difference must be at least one.");
      return;
    }
  }

  // Period conversion
  switch (period) {
    case "Daily":
      period = "1d";
      break;
    case "Weekly":
      period = "1wk";
      break;
    case "Monthly":
      period = "1mo";
      break;
    case "Minute":
      period = timeframe + "m";
      break;
    case "Hourly":
      period = timeframe + "h";
      break;
  }

  outputData.getRange("A2:H").clearContent();

  // Loop over multiple symbols
  for (var i = 10; i <= lastRow; i++) {
    symbol = inputControls.getRange("A" + i).getValue();
    var offsetCounter = 1;
    extractData(symbol, startDate, endDate, period, rng, offsetCounter, outputData);
  }

  if (outputData) {
    ss.setActiveSheet(outputData); // Set the OutputData sheet as active

    // Auto resize columns A to D (1 to 4)
    outputData.autoResizeColumns(1, 4);
  }

}

function extractData(symbols, startDate, endDate, period, rng, offsetCounter, outputData) {
  var tickerURL;

  if ((period.endsWith("m") || period.endsWith("h")) && rng > 0) {
    tickerURL = "https://query2.finance.yahoo.com/v8/finance/chart/" + symbols + "?interval=" + period + "&range=" + rng + "d";
  } else {
    tickerURL = "https://query2.finance.yahoo.com/v8/finance/chart/" + symbols + "?period1=" + startDate + "&period2=" + endDate + "&interval=" + period;
  }

  if (period.endsWith("d") && (isNaN(startDate) && isNaN(endDate))) {
    tickerURL = "https://query2.finance.yahoo.com/v8/finance/chart/" + symbols + "?interval=1d";
  }

  var response = fetchWithRetry(tickerURL, 4);
  var json = JSON.parse(response.getContentText());

  if (!json.chart.result || json.chart.result.length === 0) {
    Logger.log("No data found for: " + symbols);
    return; // No data found for the given symbol
  }

  var meta = json.chart.result[0].meta;
  var quote = json.chart.result[0].indicators.quote[0];
  var timestamps = json.chart.result[0].timestamp;
  var adjCloseData = json.chart.result[0].indicators.adjclose ? json.chart.result[0].indicators.adjclose[0].adjclose : [];

  var combinedData = [];

  for (var i = 0; i < quote.open.length; i++) {
    var row = [];
    row[0] = new Date(timestamps[i] * 1000).toLocaleString("en-US", {
      year: 'numeric',
      month: '2-digit',
      day: '2-digit',
      hour: '2-digit',
      minute: '2-digit',
      hour12: false,
    }).replace(",", "").replace(/\//g, "-");

    row[1] = quote.open[i];
    row[2] = quote.high[i];
    row[3] = quote.low[i];
    row[4] = quote.close[i];
    row[5] = adjCloseData.length > 0 ? adjCloseData[i] : ""; // Use adjCloseData if available
    row[6] = quote.volume[i];
    combinedData.push(row);
  }

  // Find the last row and write data
  var lastRow = outputData.getLastRow();
  outputData.getRange(lastRow + 1, 1, combinedData.length, combinedData[0].length).setValues(combinedData);
  outputData.getRange(lastRow + 1, 8, combinedData.length, 1).setValue(symbols); // Add the symbol in column H
}

function fetchWithRetry(tickerURL, maxRetries) {
  var attempts = 0;
  var success = false;
  var response;

  var options = {
    method: "get",
    headers: {
      "User-Agent": "Mozilla/5.0 (Windows NT 10.0; Win64; x64) AppleWebKit/537.36 (KHTML, like Gecko) Chrome/120.0.0.0 Safari/537.36"
    }
  };

  while (attempts < maxRetries && !success) {
    try {
      response = UrlFetchApp.fetch(tickerURL, options); // Attempt to fetch the URL with headers
      success = true; // If fetch is successful, exit the loop
    } catch (error) {
      attempts++;
      Logger.log("Attempt " + attempts + " failed: " + error.message);

      // Optionally, introduce a delay between retries (e.g., 2 seconds)
      Utilities.sleep(2000);
    }
  }

  if (success) {
    return response;
  } else {
    throw new Error("Failed to fetch after " + maxRetries + " attempts.");
  }
}

Deepanshu founded ListenData with a simple objective - Make analytics easy to understand and follow. He has over 10 years of experience in data science. During his tenure, he worked with global clients in various domains like Banking, Insurance, Private Equity, Telecom and HR.
Share Share Tweet